Kingwood single-family homes · October 2026
Kingwood Real Estate Market Update: October 2026 Home Prices and Trends
Kingwood’s October 2026 housing snapshot presents two signals worth reading together: the average sale price increased, while homes also took longer to sell on average. For buyers searching for homes for sale in Kingwood, TX, and homeowners preparing to list, that combination calls for a close look at comparable properties rather than a simple “prices are up” headline.
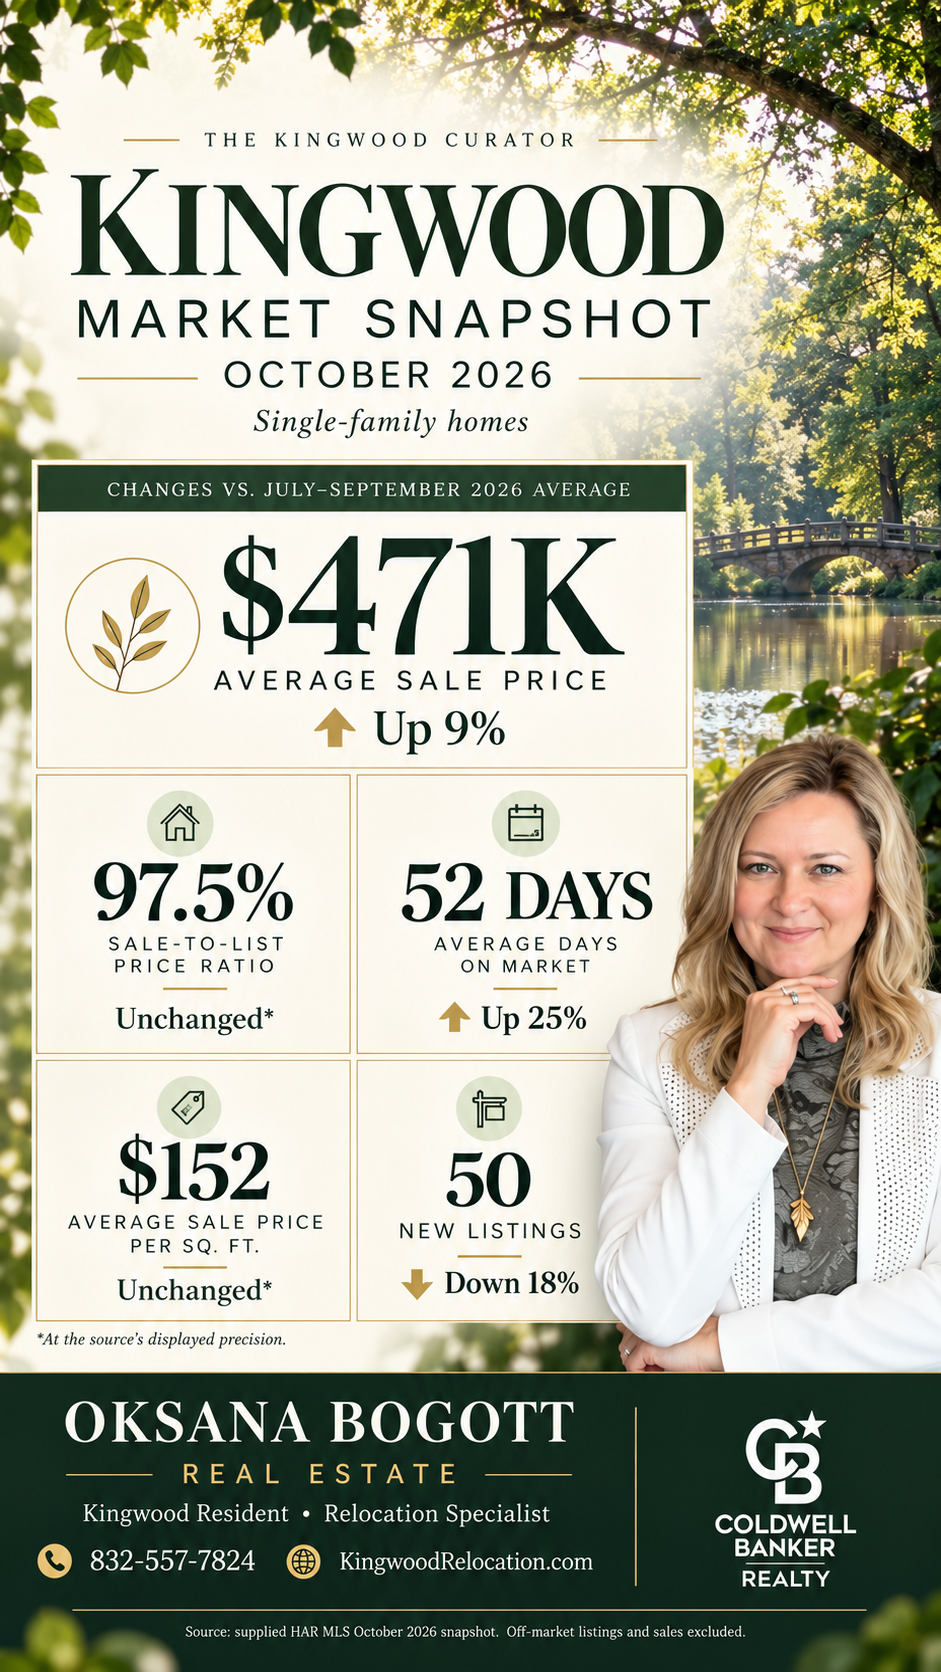
The supplied HAR MLS snapshot reports an average sale price of approximately $471,000, 52 average days on market and 50 new listings for single-family homes in Kingwood.
The numbers
Kingwood housing market at a glance
| Market indicator | October 2026 | Change versus July–September average |
|---|---|---|
| Average sale price | Approximately $471,000 | Up 9% |
| Sale-to-list price ratio | 97.5% | Displayed as 0% change |
| Average days on market | 52 days | Up 25% |
| Average sale price per square foot | $152 | Displayed as 0% change |
| New listings | 50 | Down 18% |
Source: supplied Houston Association of REALTORS® MLS Market Snapshot for Kingwood, TX, single-family homes, covering July–October 2026. Values and percentage changes are rounded as displayed. Off-market listings and transactions are excluded, including builder inventory and sales absent from MLS.
01 · Market analysis
Kingwood home prices: understanding the 9% increase
October’s average sale price of approximately $471,000 was 9% above the preceding three-month average. This describes the average price of the homes sold in the source dataset. It does not mean that every Kingwood property appreciated by 9%.
The mix of homes sold matters. A month containing more larger or higher-priced properties can lift the average without an equivalent increase in the value of comparable individual homes. The supplied graphic does not include the median sale price, the number of closings or a village-level breakdown, so it cannot isolate the cause of the increase.
For a specific property, I would start with recent sales that share its location, size, condition and features. A Kingwood-wide average is useful context, but it cannot replace a tailored comparison.
02 · Market analysis
Why the $152-per-square-foot figure matters
The average sale price per square foot was $152, with the source displaying a 0% change from the comparison period. That means essentially unchanged at the graphic’s displayed precision, rather than proof of an exactly identical underlying figure.
Read alongside the higher average sale price, the broadly unchanged price-per-square-foot figure is a reason to investigate the size and type of homes sold. It is consistent with the possibility of a different sales mix, but it does not establish that explanation by itself.
Price per square foot also varies with property characteristics. Lot size, improvements, layout and condition can make two similarly sized homes different propositions. Multiplying every Kingwood home’s square footage by $152 would overlook those differences.
03 · Market analysis
Homes averaged 52 days on market
Average days on market reached 52 days, up 25% versus the July–September average. This suggests a longer average marketing period for the homes represented in the source calculation.
For sellers, it is a reason to take pricing and presentation seriously and to set realistic expectations. It does not predict that every listing will take 52 days to sell. Some properties may attract an acceptable offer much sooner; others may require more time.
For buyers, marketing time is one part of the investigation. A longer listing history may justify a closer look at earlier prices and competing properties, but it does not prove that a seller is distressed or will accept a particular discount.
04 · Market analysis
Are sellers reducing prices in Kingwood?
The supplied snapshot does not contain original asking prices, revised prices or price-change dates. It therefore cannot establish how many listings had price reductions or the typical size of those cuts.
An advertised reduction and a sale below asking price measure different things. A seller may reduce the asking price before receiving an offer; a buyer may also negotiate below the list price used in a sale-to-list calculation. Separately documented concessions add another layer to the transaction.
For a reliable October price-reduction analysis, I would need MLS listing histories covering homes that remained active as well as those that sold, expired or were withdrawn. Longer average marketing time alone is not evidence of widespread price cuts.
05 · Market analysis
What does the 97.5% sale-to-list ratio mean?
The reported sale-to-list price ratio was 97.5%, which is 2.5 percentage points below 100%. It indicates sale prices below the list prices used in the source’s calculation, on average under that methodology.
It does not mean every buyer received a 2.5% discount. The graphic does not specify whether the ratio uses original or final list prices, or how the result is weighted. It also does not establish the value of concessions.
The source displays a 0% change in the ratio, so the most careful interpretation is that it was essentially unchanged at the displayed precision.
06 · Market analysis
Fifty new listings: fewer homes entered the market
Kingwood recorded 50 new listings in October, down 18% compared with the previous three-month average.
New listings count homes entering the market during the month. They do not represent total active inventory. Without the active listing count, closing volume and other supporting figures, this snapshot cannot establish whether the overall supply of available homes increased or decreased.
Buyers should review the full selection of suitable homes rather than limit their search to new arrivals. Sellers should compare directly with the properties buyers can choose from today.
07 · Market analysis
My perspective as a Kingwood resident REALTOR®
My reading of this snapshot is that October brought a higher average closed-sale price alongside a longer average marketing period, while fewer new listings entered the market. Those signals do not establish a uniform trend across every village or price range.
As a Kingwood resident whose children grew up here, I combine a local perspective with property-specific analysis. For a buyer, that means comparing the right homes and understanding the details behind each listing. For a seller, it means positioning the property against relevant recent sales and current competition.
This report does not provide enough information to label the entire Kingwood market a buyer’s or seller’s market. The more useful next step is to narrow the analysis to your home or target search area.
Source and methodology
Source: supplied Houston Association of REALTORS® MLS Market Snapshot for Kingwood, TX, single-family homes, covering July–October 2026. Values and percentage changes are rounded as displayed. Off-market listings and transactions are excluded, including builder inventory and sales absent from MLS.
This article analyzes the supplied HAR MLS snapshot; it is not a separate live MLS search. Figures are rounded. Off-market listings and sales are excluded. Information is deemed reliable but is not guaranteed. This is independent market commentary, not an appraisal.
The report does not include village-level selling speeds, the median sale price, closing count, total active inventory or listing-price histories. Those missing fields have not been estimated or filled in.
View the supplied market visual · All Kingwood Market Snapshots